Skip to content

The INDVIL book, Data Visualization in Society, is finally out! Edited by Helen Kennedy and Martin Engebretsen, the book offers no less than 26 chapters, covering various aspects of the phenomenon named in the title. The book is freely accessible online, or it can be bought in print version, following this link: https://www.aup.nl/en/book/9789048543137/data-visualization-in-society

A big thanks to all the authors (38 authors from a number of countries have been involved) and to Amsterdam University Press for their commitment and support during a long, but yet enjoyable process.  Also, thanks to Alberto Cairo for writing an insightful foreword to the book, and to Johanna Drucker and Lev Manovich for endorsing it.

ENDORSEMENTS FOR DATA VISUALIZATION IN SOCIETY

"This book offers unique and much needed perspectives on data visualization culture. While most books still approach the subject in a practical 'how to' way, Data Visualization In Society offers a range of critical reflections on key social and cultural dimensions of visualization culture. This is the book we have been waiting for."

Lev Manovich, Professor of Computer Science, The Graduate Center, City University of New York & Director, Cultural Analytics Lab

“The articles in this expertly edited volume make a crucial contribution to critical studies in the area of data visualization. Focused on a broad range of topics including activism, literacy, accessibility, social disparity, gender politics, and professional practices, the papers demonstrate in case after case the rhetorical power of visualizations and the need to engage critically with that power.”

Johanna Drucker, Breslauer Professor and Distinguished Professor of Information Studies, UCLA

“I often joke—although I’m inclined to believe—that a field X reaches maturity when a parallel field of ‘philosophy of X’ springs into existence. […] Data Visualization in Society is a collection of chapters by scholars and professionals who don’t call themselves philosophers of visualization but who, in practice, operate as such. I see this book as a relevant step toward the possible inception of the philosophy of data visualization as a discipline.”

From the Foreword by Alberto Cairo, Knight Chair at the University of Miami and author of ‘How Charts Lie’
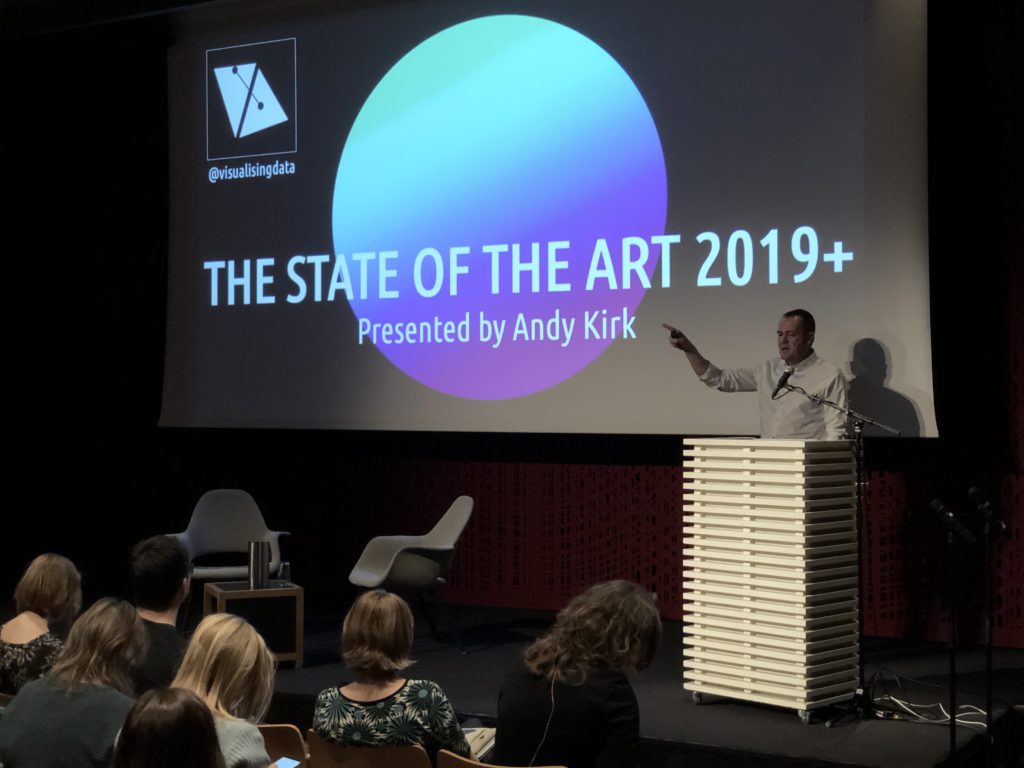
The British dataviz expert Andy Kirk was keynote speaker at the INDVIL concluding seminar at Litteraturhuset in Oslo on November 14th.

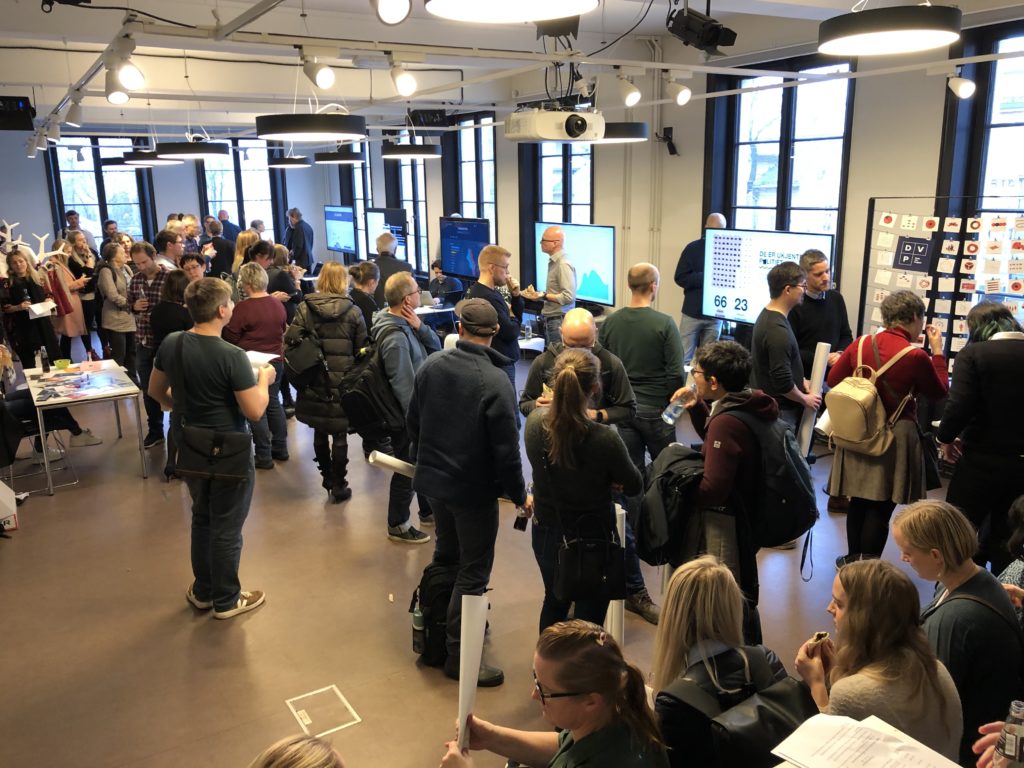
After near four years of research, INDVIL invited stakeholders, scholars and the interested public to a concluding seminar - a "Fagdag" - at Litteraturhuset in Oslo on November 14th. It was a complex event, with 18 presenters, four parallel sessions and an exhibition with eight exhibitors, spread over three floors in the building. In addition to the nine members of the INDVIL team, eight experts from the practice field contributed with presentations in the parallel sessions, and the soon coming INDVIL book, Data Visualization in Society, was presented in the main hall in front of about 150 designers, journalists, teachers and scholars.

The exhibition hall was lively during all breaks in the seminar program.
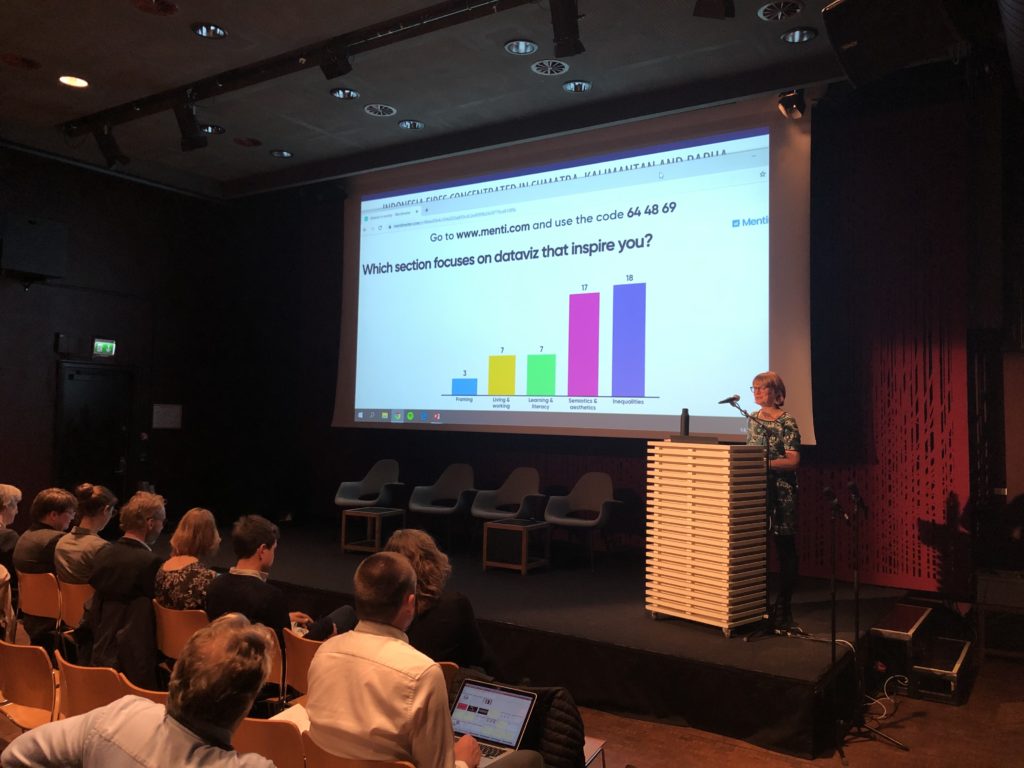
Helen Kennedy made the audience take an active role in the presentation of the soon coming INDVIL-book, Data Visualization in Society.
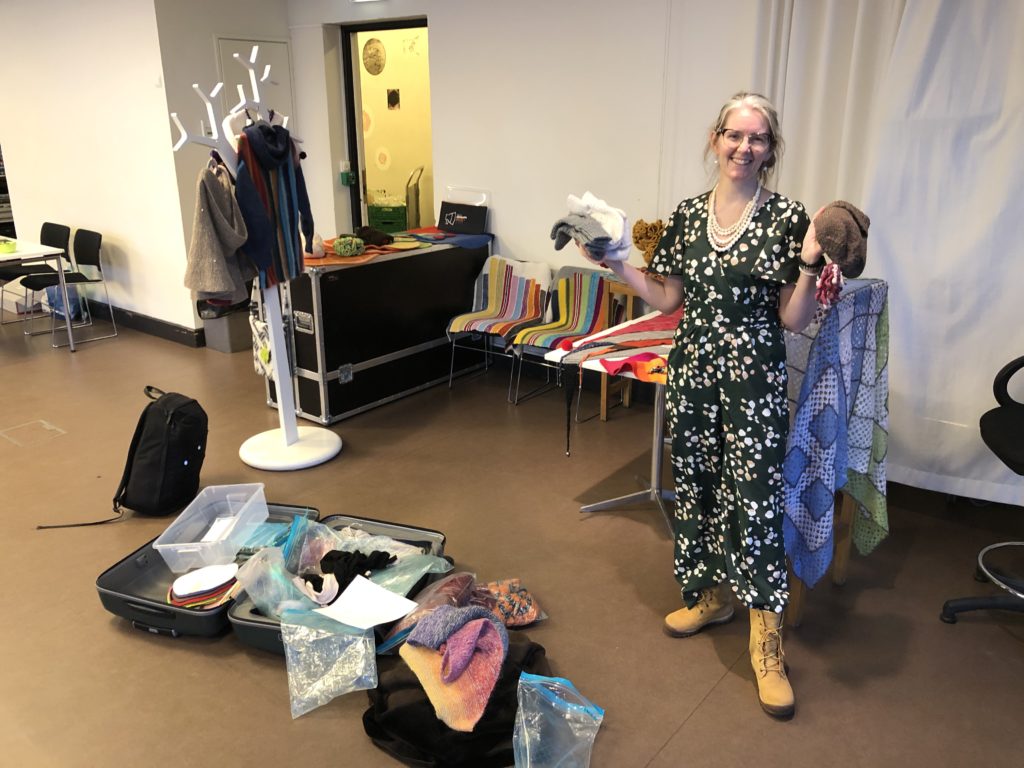
Statistician and blogger Kathrine Frey Frøslie showed in the exhibition that dataviz can be knitted!


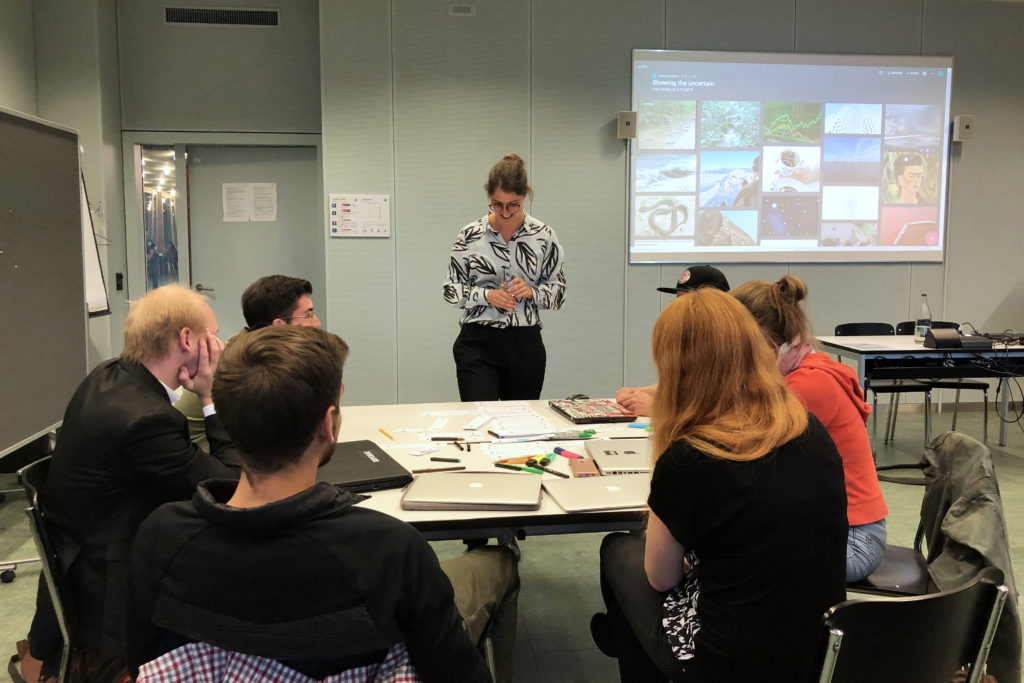
Indvil’s PhD-fellow Verena Lechner presented her research on connecting lines to design students at Zurich University of Applied Science (ZHAW) last week. Looking at other forms of lines, found in the physical world, made the student reflect on what makes a graphical line appear solid or weak.

The students were also asked to draw their own lines on sheets of paper, suggesting how they would visualize an uncertain connection between to points.

Time and place: November 14, 2019, 1200 PM - 6.30PM, House of Literature in Oslo

The concluding conference of the INDVIL project takes place on November 14th, from 12:00 pm to 6.30 pm in the House of Literature in Oslo. The conference is aimed at the general public as well as stakeholders and researchers interested in issues on data visualization in society. More information can be found here.

Martin Engebretsen posing with some of the participants in the seminar on data visualization at Hong Kong Baptist University on April 10.

INDVIL-leader Martin Engebretsen presented INDVIL-research for staff and phd-students at Hong Kong Baptist University during a visit to the university the week before Easter. The audience was easily engaged in the problems raised, and a lot of interesting viewpoints came to surface in the discussion after the talk.

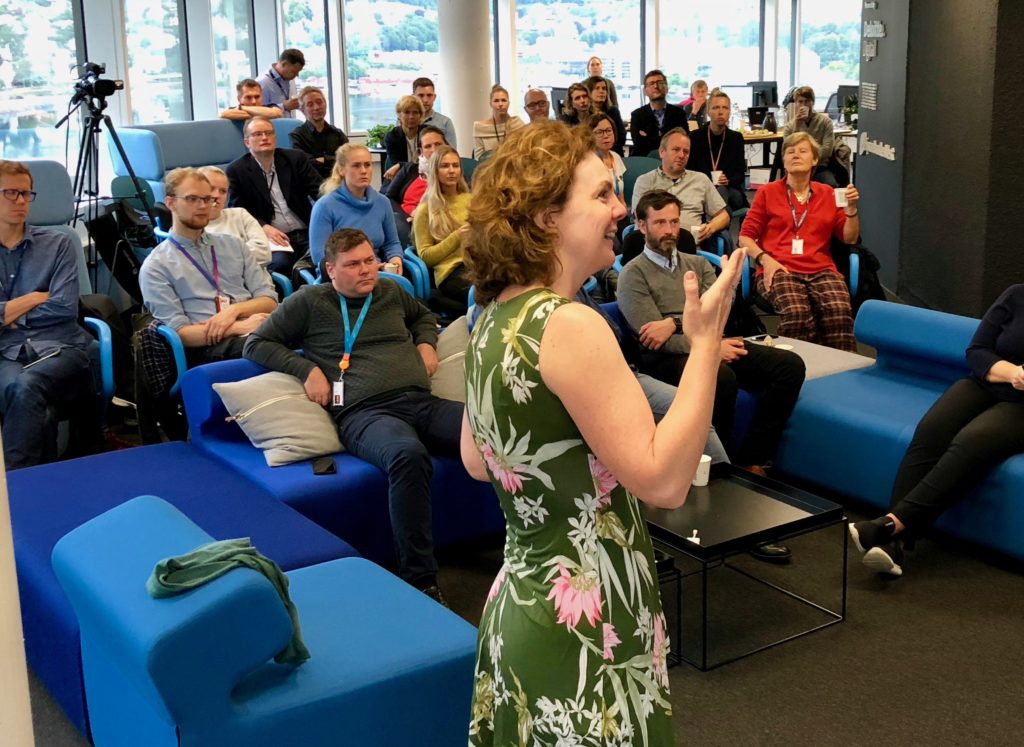
INDVIL-members Jill Walker Rettberg and Martin Engebretsen presented latest research findings at a breakfast meeting in the new hub for media practitioners in Bergen, Media City Bergen. The theme for the meeting was "Data visualization in the news", and the audience of 45 counted many staff members from major news providers, like TV2, NRK and Bergens Tidende. Also on the list of presenters was DV-developer Anders Grimsrud Eriksen (far left in the picture) from Bergens Tidende, offering a great meeting between research and practice.

25 authors met at Metochi, a study center run by University of Agder on the Greek island of Lesvos, last week – preparing for their upcoming book on «Data visualization in society». The highly international group of scholars was invited by the research group INDVIL to share their drafts, ideas and inspiration for three intensive days. A big thanks to all participants for great days!

This week we received a signed contract from the publisher of our upcoming edited volume with the preliminary title Data Visualization in Society. Investigating the Social Power of Graphs, Charts and Maps. The contract is signed by Amsterdam University Press, University of Agder and the INDVIL team, represented by the editors, Helen Kennedy and Martin Engebretsen. The book will have 23 chapters, written by international experts in a range of related fields of research. In June 5-7, we will all meet at the Greek island Lesbos, where University of Agder runs a study center, to present and discuss first drafts of the chapters. The book launch is planned in late spring 2019, in print and digital versions, and as an open access publication.


Martin, Elise, Sara and Verena from the INDVIL team together with other attendants at the international workshop on dataviz in a school context held at University of Agder, September 13th. and 14th.Theo van Leeuwen and Len Unsworth (no. 2 and 8 from the left) came all the way from Sydney to share and discuss ideas concerning data visualization and other forms of visual models of reality in a context of learning. The workshop was organized by the nordic project REED (Remediation of Education) on cooperation with INDVIL.

Wibke Weber and Martin Engebretsen posing together with Ebad Banissi, chief organizer of the conference IV17.


Wibke Weber and Martin Engebretsen attended the conference Information Visualization 2017 in London mid July. Here they presented initial results from an interview study covering 26 European newsrooms, with a paper written together with Helen Kennedy. The inter-disciplinary conference, number 21 in a series, brought together 80 researchers from around the world.